Low, flat and early: what leadership teams told the FLAIR Scorecard
What the FLAIR Scorecard shows about how leadership teams run AI. Data from 1 October to 14 November 2026.

Data from 1 October to 14 November 2026, checked against the latest outside research.
Every few weeks someone tells me their AI programme is going well, and I ask the same question: how do you know?
Usually there's a pause. Then a list of things that have launched.
The FLAIR Scorecard exists to answer that question properly. A leadership team scores itself across the five pillars of FLAIR (Foundation, Leverage, Activation, Iteration and Realisation), each out of five, for a total out of 25. It takes a few minutes, and it's the first tool in From Hype to Habit for a reason.
This is the first proper look at what it's telling us. I've broken it down by pillar, stage, industry and organisation size, and checked each finding against the outside research, including where that research disagrees with us.
The headline: low and flat
The average total is 11.7 out of 25. Just under halfway.
What interests me more is the shape. The five pillar averages sit between 2.06 and 2.53. That's a narrow band. There's no pillar where organisations are strong and the rest are lagging. They're early across the board.
That matters, because most AI programmes are designed as if there's one problem to solve: get the data right, or pick the right use case, or train the team. The data says most organisations have all five problems at once, at roughly the same size.
Iteration is the weakest pillar, and the outside evidence agrees
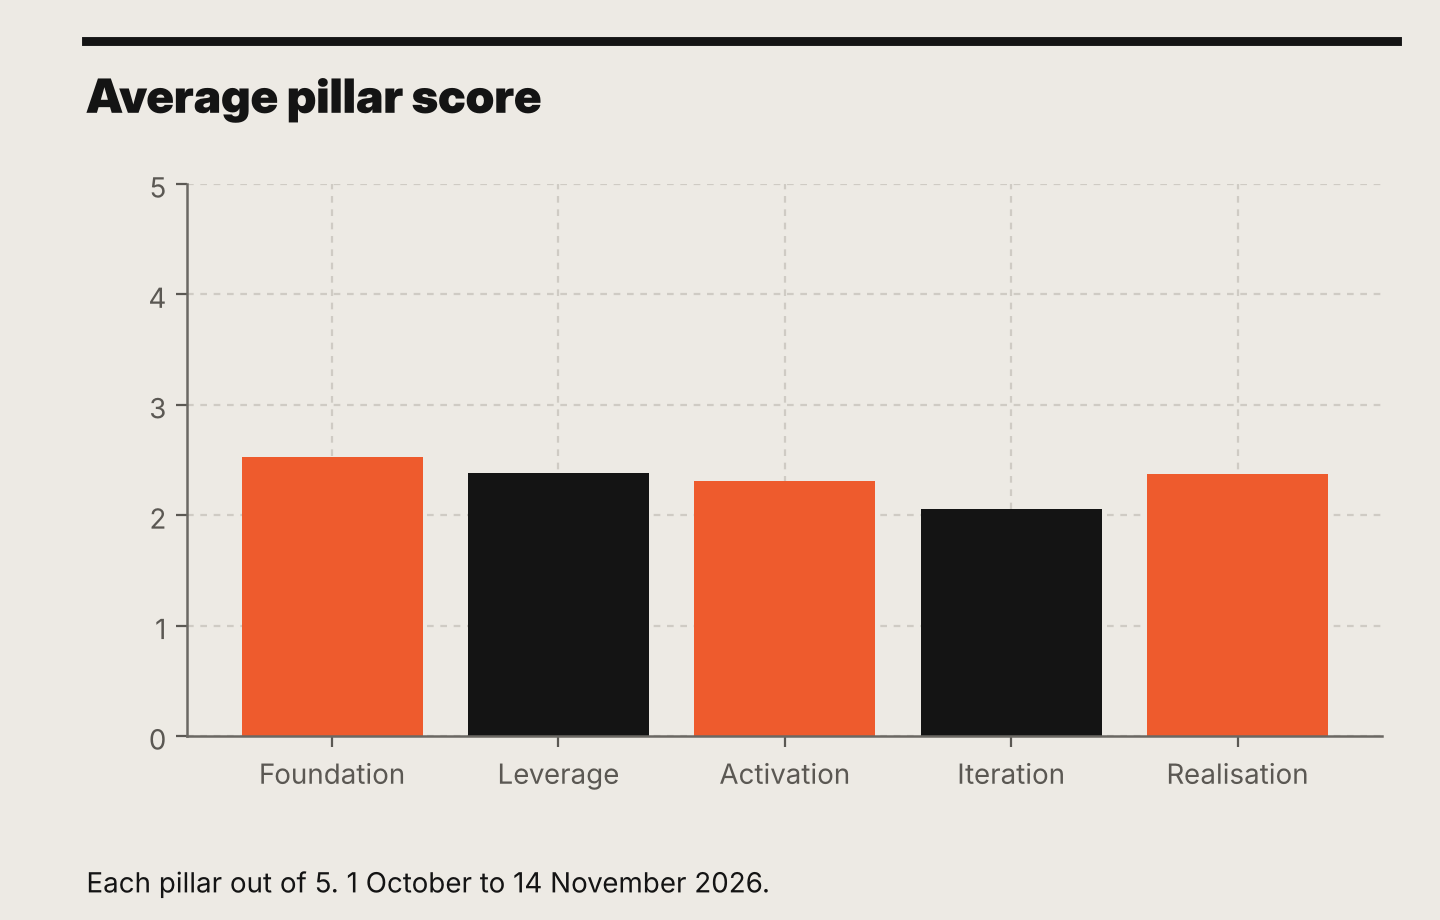
Iteration is the lowest-scoring pillar on average, at 2.06 out of 5. Foundation is the highest, at 2.53.
Iteration is the unsexy one. It asks whether anyone is still checking, tuning and owning an AI assistant once it's live, and whether it's still right three months later, when the data underneath has shifted, the prompts have aged and the person who built it has moved on to the next shiny thing.
The outside research backs this up. McKinsey found that of all the practices it tested, tracking well-defined KPIs for generative AI had the most impact on the bottom line, and that fewer than one in five organisations do it (McKinsey, March 2025). In other words, the habit that pays most is the one almost nobody has.
Gartner adds the consequence. Among organisations with high AI maturity, 45% keep their AI projects in production for three years or more. Among low-maturity organisations, it's 20% (Gartner, June 2025). The same survey found that 91% of high-maturity organisations have appointed dedicated AI leaders. Somebody owns it. That's most of what Iteration measures.
But there isn't one bottleneck
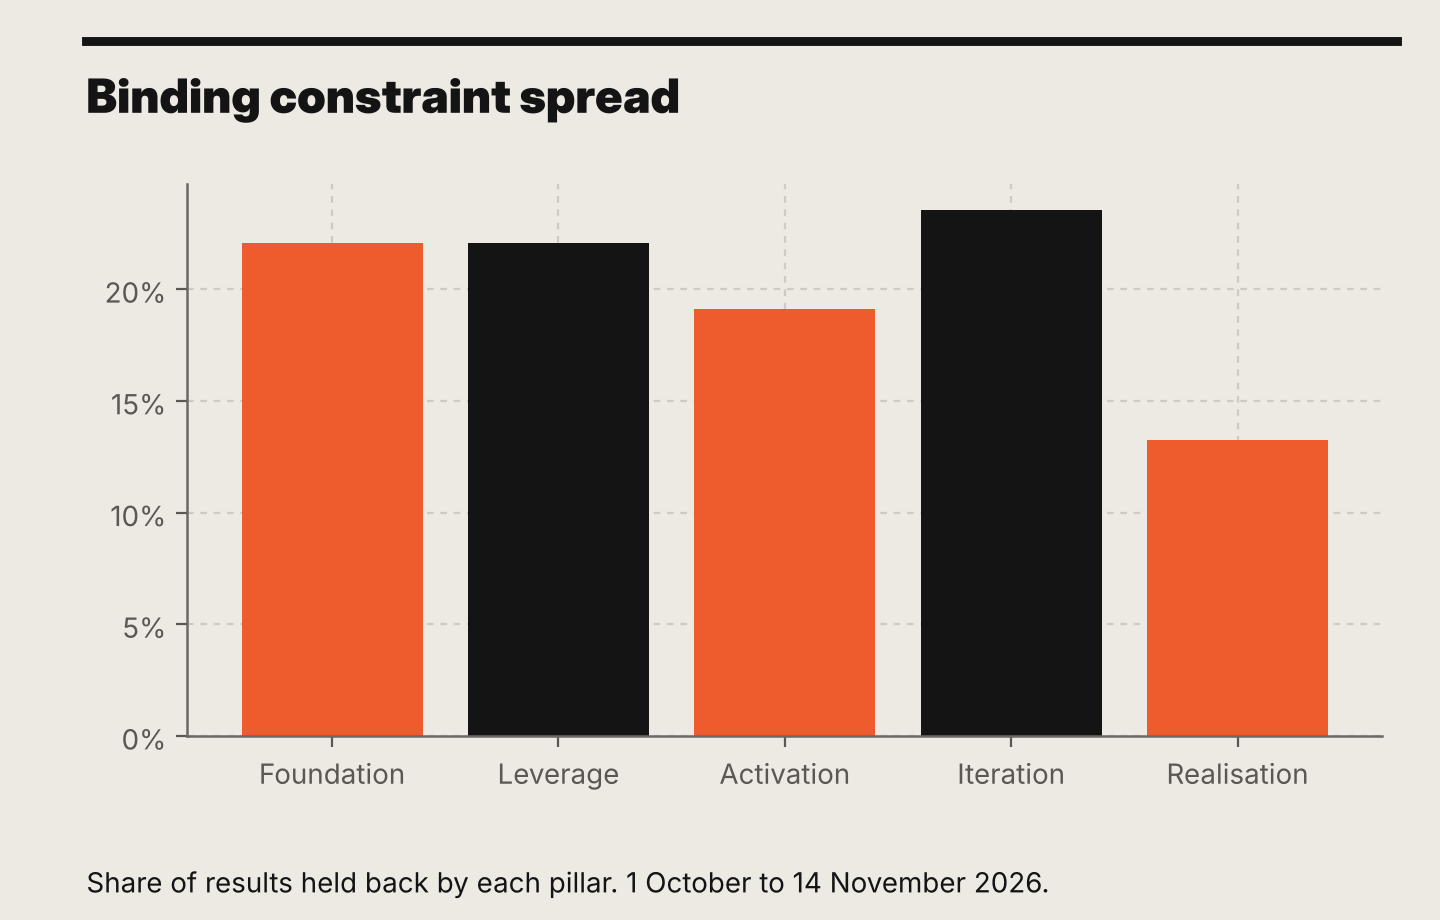
The Scorecard also names a binding constraint for each result: the single pillar holding the others back. If Iteration were everyone's problem, it would dominate this chart.
It doesn't. Iteration is the most common binding constraint, in just under a quarter of results. Foundation and Leverage each hold back just over a fifth, and Activation isn't far behind. Only Realisation is noticeably less common, which makes sense: you rarely get far enough for Realisation to be the thing in your way.
This is the most useful finding in the data, and the easiest to miss. The average says "fix Iteration". The individual results say every leadership team's bottleneck is different, and a programme built for the average fits nobody. Before anyone buys anything, they need to know which pillar is theirs.
Foundation being so close behind is no surprise. Gartner predicts that through 2026, organisations will abandon 60% of AI projects that aren't supported by AI-ready data, and that 63% of organisations either don't have, or aren't sure they have, the right data management practices for AI (Gartner, February 2025). The two weakest areas sit either side of the build: the groundwork before it and the upkeep after. The build itself, the part most budgets go on, is rarely the problem.
The 5% shows up here too
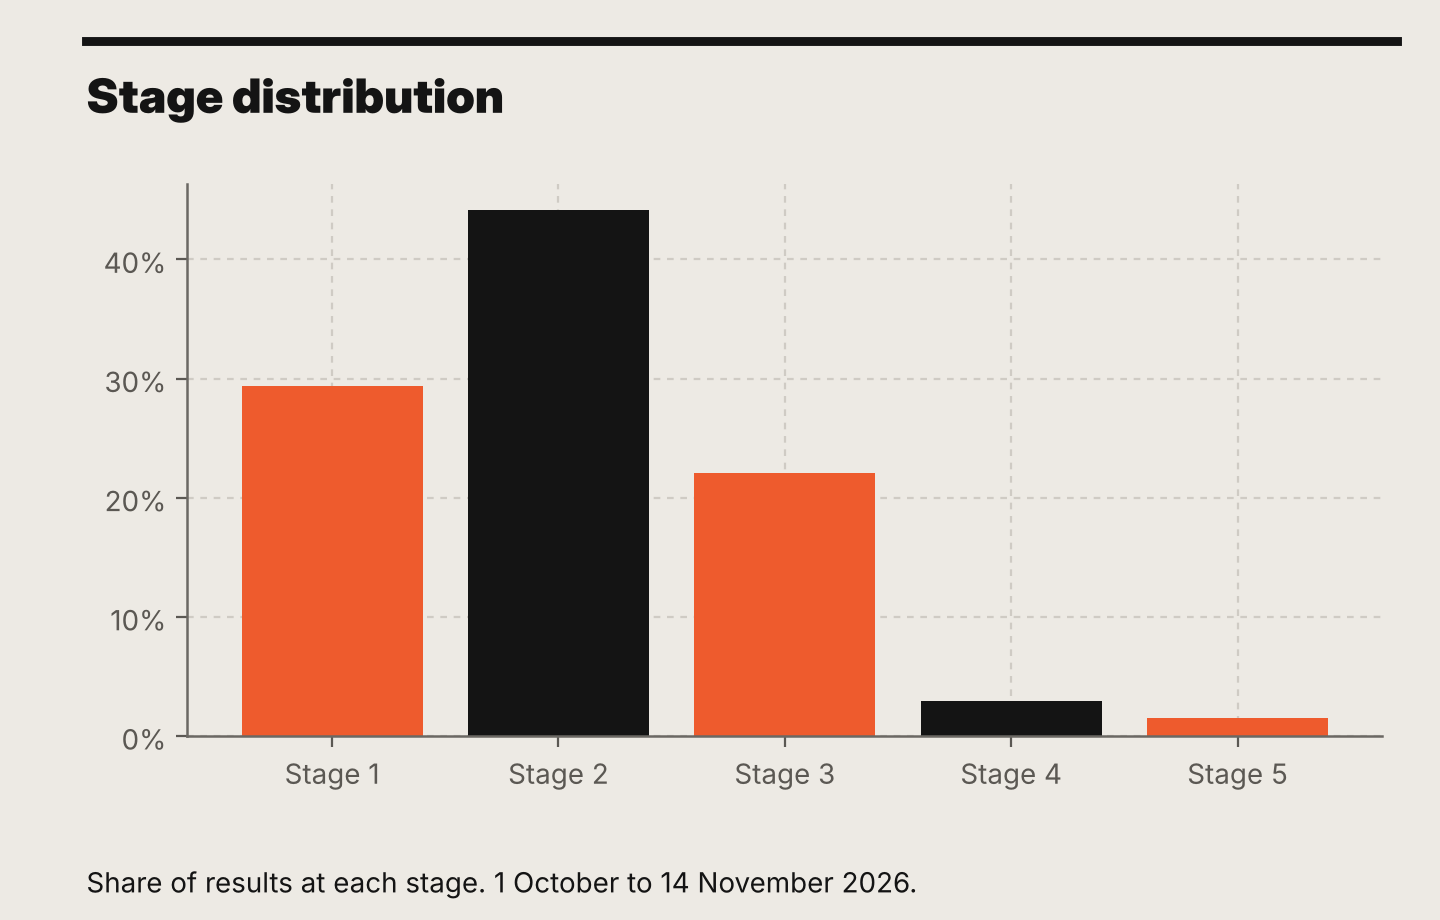
The Scorecard places each result on one of five stages. About three quarters of results sit at Stage 1 or 2. Fewer than one in twenty reach Stage 4 or 5, where AI has stopped being a project and become part of how the business runs.
That's strikingly close to what the big surveys find, using completely different methods. McKinsey puts AI high performers, organisations getting 5% or more of EBIT from AI, at 6% of respondents, unchanged from 2025 (McKinsey, The state of AI in 2026). BCG found that only 5% of companies are achieving AI value at scale, and that 60% aren't achieving material value at all (BCG, The Widening AI Value Gap, 2025).
Three different instruments, one shape: a small group at the top, and most organisations still in the early stages. I'd have been more worried if ours had come out rosier.
Industry: technology firms are further along, and still leak at Iteration
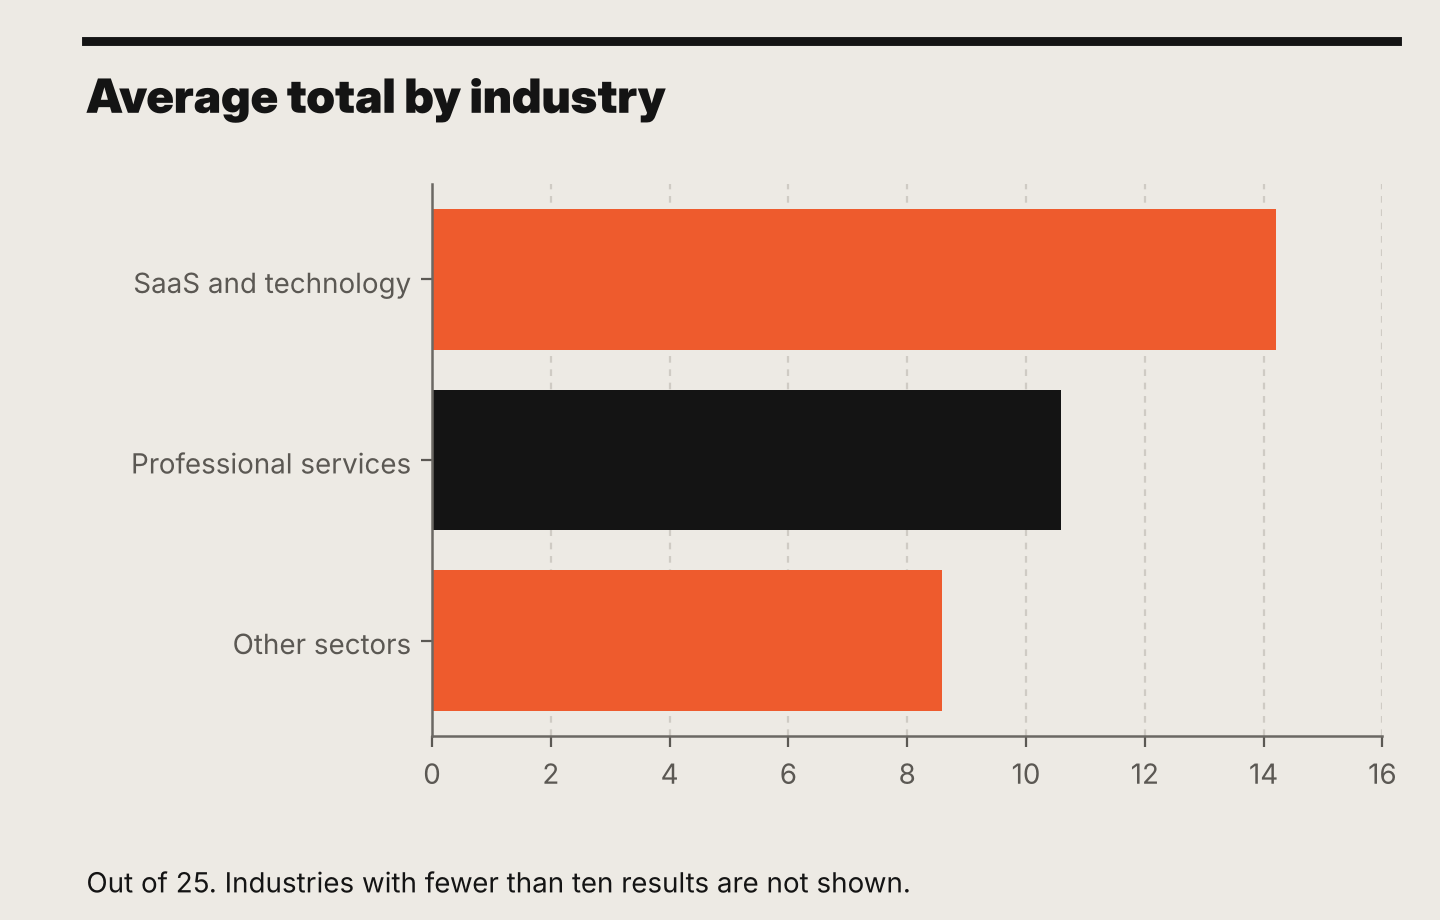
SaaS and technology firms average 14.2 out of 25. Professional services firms average 10.6. Everything else combined averages 8.6. (Financial services, retail, manufacturing and healthcare are in the data but don't yet have enough results to report on their own.)
The gap shows up in the stages too. Nearly half of SaaS and technology results are at Stage 3 or above. In professional services it's about one in seven.
BCG's research says the same: software, telecoms and payments lead the maturity race, with sectors like chemicals and real estate at the lower end (BCG, 2025). No surprise there.
The more interesting bit is inside each group. Technology firms score highest on Foundation (3.17), which you'd expect from businesses whose product is data and systems. Their lowest pillar is still Iteration (2.54). They've built the groundwork and they've built the tools. Keeping them right is where it slips, even for the people who build software for a living.
Professional services firms score lowest on Iteration (1.86) and Leverage (2.0). Leverage is about choosing fewer things and pushing them deeper. A low score there usually means AI spread thinly across lots of small experiments, none of which gets the attention it needs. I run a professional services firm, so this one lands close to home. It's also the sector where so much of the work is exactly the kind of knowledge work AI is supposed to change, which makes the gap more expensive.
Size: mid-sized firms have built more and maintain less
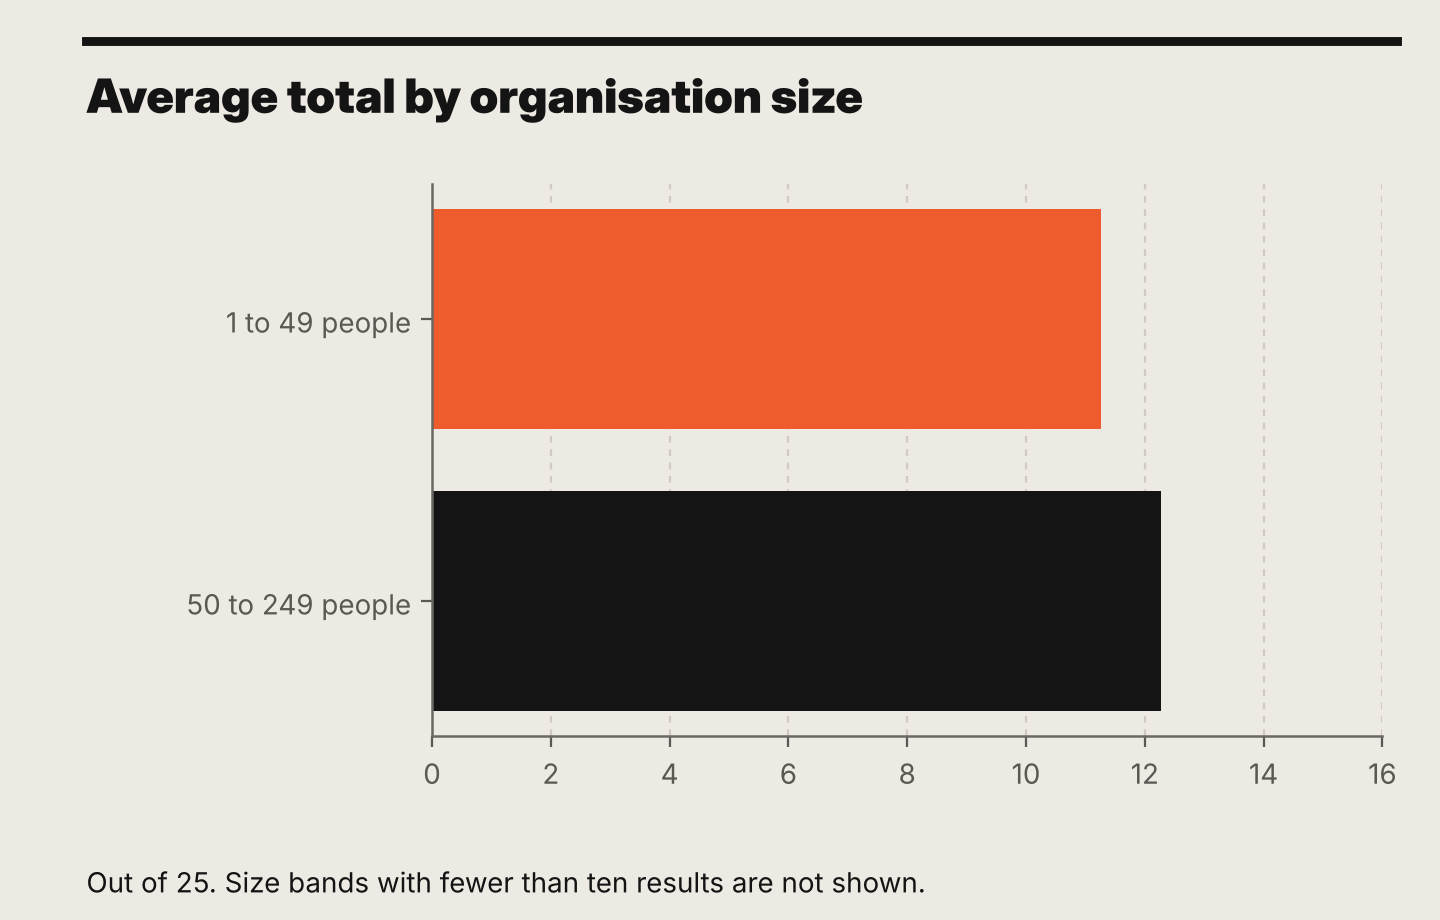
Organisations with 50 to 249 people average 12.3. Those with fewer than 50 average 11.3. Larger organisations are in the data, but not yet in numbers I'd publish.
That direction matches the outside research. McKinsey found that 54% of respondents from organisations with at least $1 billion in revenue say AI is scaling across the enterprise, against about a third at smaller organisations (McKinsey, 2026). Bigger tends to mean further along.
The shape is where it gets interesting. Small firms are flat: every pillar sits between 2.15 and 2.39. They're early everywhere, and evenly so. Firms with 50 to 249 people score 2.68 on both Foundation and Leverage, but 1.86 on Iteration. That's the widest gap between pillars in any group we can report on. They've done the groundwork, picked their use cases, launched things. Then nobody keeps them running.
RSM's survey of the US middle market tells a similar story from the other side: 91% of mid-market firms use generative AI, but only one in four users say it's fully integrated into the business, and data quality is the most common implementation problem (RSM, June 2025). Plenty started. Not much stuck.
Role: the gap we can't measure yet
I'd love to tell you whether chief executives rate their AI programmes higher than the people running them. I can't, yet. Most people skip the role question, and no role group is big enough to report on honestly.
The outside research says it's worth asking. A Writer and Workplace Intelligence survey found that 75% of the C-suite believe their organisation has successfully adopted generative AI, against 45% of employees (Writer, March 2025). But it doesn't always run that way. Kyndryl found technology chiefs more optimistic than chief executives about whether employees are embracing AI: 73% of CTOs and CIOs said most employees are embracing it, against 45% of CEOs (Kyndryl, People Readiness Report 2025).
So perception gaps are real, but their direction depends on the question. That's the best argument I know for a leadership team taking the Scorecard separately and comparing answers. The place where your chief executive and your head of data disagree is usually the place your programme will stall.
What I'd do with this
If you lead a team running AI, four things:
Take the Scorecard individually, then compare. The disagreement is the finding.
If Iteration is your weakest pillar, start a weekly check. Pick your most used assistant, write twenty questions it should answer well, run them every week and note what's drifted. Put one person's name next to it. A person, not a team.
If you're between 50 and 250 people, stop launching for a quarter. Get what you've already built properly owned and measured before you add anything new.
If you're in professional services, pick fewer things. Two use cases pushed deep will beat ten spread thin.
None of this needs a new tool. It needs the habit of checking.
The organisations that skip it won't notice this quarter. They'll notice when someone asks what the last year of AI spend actually returned, and nobody can say.
Take the Scorecard
It's free and takes a few minutes. Tell us your role when you do: it's the gap in our data I most want to close. Take it this month and you're in next month's numbers.
Rich
Method: completed FLAIR Scorecard results from 1 October to 14 November 2026, including anonymous results, with test runs excluded. Industry, size and role are self-reported in the Scorecard. Any group with fewer than ten results is left out of the breakdowns. Scores are self-assessed by people who chose to take the Scorecard, so read them as a picture of that group rather than of every organisation.
Sources
McKinsey, "The state of AI: How organizations are rewiring to capture value", March 2025: https://www.mckinsey.com/capabilities/quantumblack/our-insights/the-state-of-ai-how-organizations-are-rewiring-to-capture-value
McKinsey, "The state of AI in 2026: On the road to ROI", August 2026: https://www.mckinsey.com/capabilities/quantumblack/our-insights/the-state-of-ai
Gartner, "Gartner Survey Finds 45% of Organizations With High AI Maturity Keep AI Projects Operational for at Least Three Years", June 2025: https://www.gartner.com/en/newsroom/press-releases/2025-06-30-gartner-survey-finds-forty-five-percent-of-organizations-with-high-artificial-intelligence-maturity-keep-artificial-intelligence-projects-operational-for-at-least-three-years
Gartner, "Lack of AI-Ready Data Puts AI Projects at Risk", February 2025: https://www.gartner.com/en/newsroom/press-releases/2025-02-26-lack-of-ai-ready-data-puts-ai-projects-at-risk
BCG, "The Widening AI Value Gap", 2025: https://media-publications.bcg.com/The-Widening-AI-Value-Gap-October-2025.pdf
RSM, "Middle market firms rapidly embracing generative AI, but expertise gaps pose risks", June 2025: https://www.rsmus.com/newsroom/2025/middle-market-firms-rapidly-embracing-generative-ai-but-expertise-gaps-pose-risks-rsm-2025-ai-survey
Writer and Workplace Intelligence, enterprise AI adoption survey, March 2025: https://www.writer.com/blog/enterprise-ai-adoption-survey/
Kyndryl, People Readiness Report 2025: https://www.kyndryl.com/content/dam/kyndrylprogram/doc/en/2025/people-readiness-report.pdf
Questions and answers
- What is the FLAIR Scorecard?
- A free diagnostic that takes a few minutes. A leadership team scores itself on the five FLAIR pillars (Foundation, Leverage, Activation, Iteration and Realisation), each out of five, for a total out of 25.
- What is the average FLAIR Scorecard score?
- 11.7 out of 25, for results from 1 October to 14 November 2026.
- What is the weakest area of AI adoption?
- Iteration: keeping AI assistants checked, tuned and owned after launch. It averages 2.06 out of 5, the lowest of the five pillars.
- Is there one main bottleneck to getting value from AI?
- No. Iteration, Foundation and Leverage are each the binding constraint for between a fifth and a quarter of results, so each leadership team needs to find its own.
- How many organisations have AI working at scale?
- Fewer than one in twenty Scorecard results reach Stage 4 or 5. McKinsey puts AI high performers at 6% of companies, and BCG finds 5% achieving AI value at scale.
- Which industries are furthest ahead with AI?
- SaaS and technology firms average 14.2 out of 25, and nearly half are at Stage 3 or above. Professional services firms average 10.6, with about one in seven at Stage 3 or above.
- How does organisation size affect AI maturity?
- Firms with 50 to 249 people average 12.3, against 11.3 for firms with fewer than 50. Mid-sized firms score well on Foundation and Leverage but lowest on Iteration.
- How can a leadership team improve its Iteration score?
- Pick your most used AI assistant, write twenty questions it should answer well, run them every week, note what has drifted and give it one named owner.
Comments
No comments yet.
Leave a comment
Loading the comment form